
Database Design#
Introduction#
A database is a systematically organised collection of data stored and designed in a way that makes it easy to access, manage, and analyse information.
The Smart Health database will act as a foundationary repository for research data from which researchers can request data extracts for cardiovascular research projects. Any bona fide researcher will be able to apply to access the linked smartphone, wearable, and NHS datasets. This will facilitate research seeking to predict, prevent, diagnose and monitor any human disease.
The processing pipeline produces a range of daily summary metrics for physical activity, sleep, heart rate, and environmental exposures. These research-ready datasets will be linked to NHS data.
Note
The MVP focuses on developing the pipeline that generates the daily summary metrics from Fitbit devices and GPS data.
Entity-relationship Diagram#
An entity relationship diagram (ERD) is a high-level visual representation of the data model of the database. It describes the relationships between core objects and concepts within a system.
Below is the ERD for the database developed in the initial MVP phase.
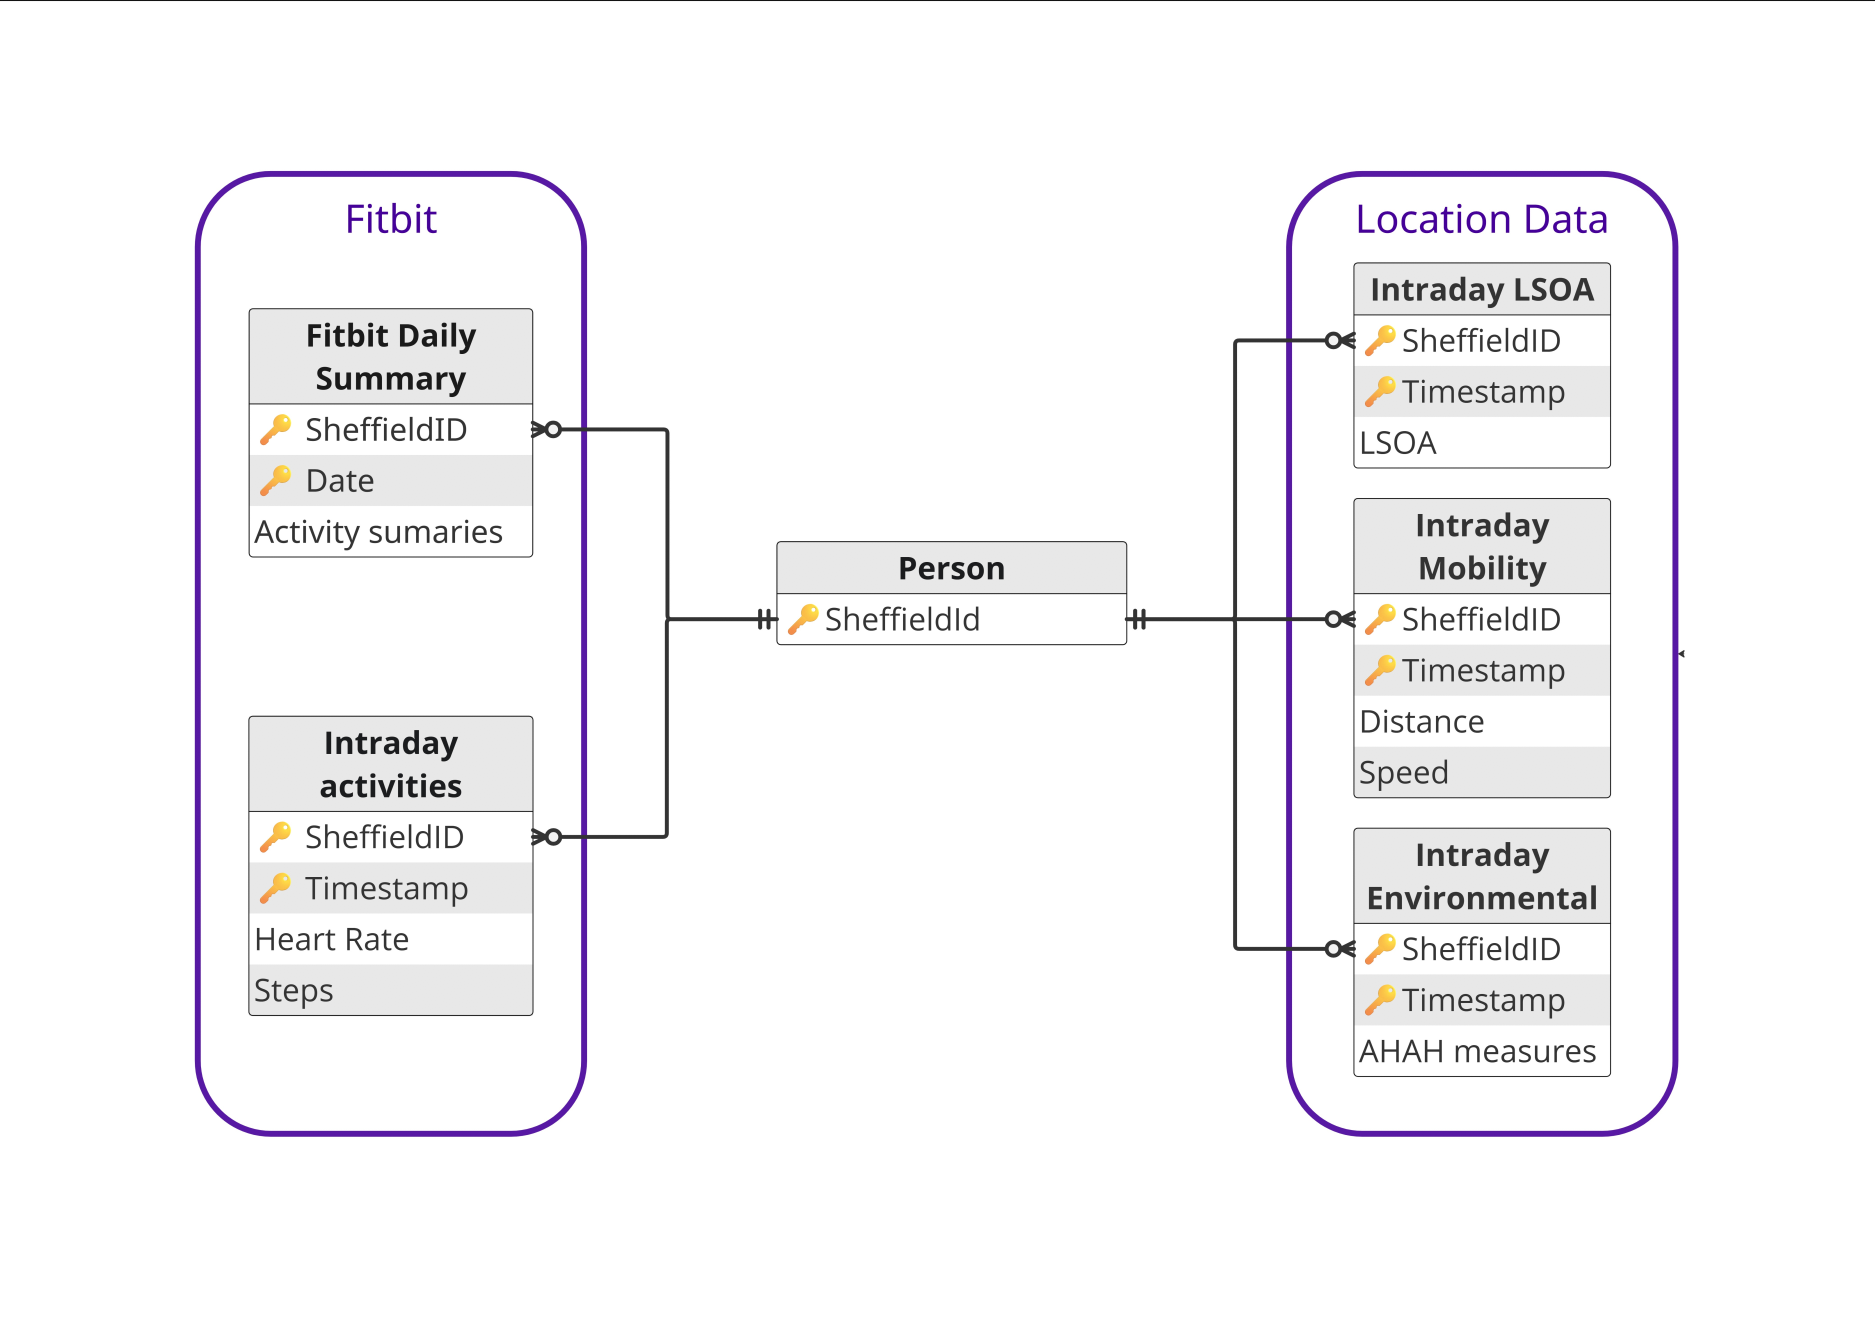
An ERD showing the relationships between the database tables containing Fitbit, processed GPS, and environmental data.#
Each study participant is assigned a unique sheffield_id. If they have consented to sharing their Fitbit data, this sheffield_id will be associated with their ‘Daily Summary’ and ‘Intraday Activities’ data in a one-to-many relationship - one participant can have many (or none) records in these data tables.
Similarly, if a participant has consented to sharing their GPS data, they can have many records of their intraday Lower Super Output Area (LSOA), mobility, and environmental data.
The data tables are associated with a participant by a composite primary key consisting of their sheffield_id and a date or timestamp that identifies each record.
Tip
A primary key is a unique identifier for a record in a table. A primary key can be a composite key which consists of two or more columns in a database table that uniquely identify a row.
Data Dictionary (MVP only)#
Click the toggle button below to see the data dictionary of fields generated by the MVP pipeline.
This dictionary includes information about the field name, it’s device or reference data source (e.g. Fitbit or smartphone GPS, or external reference data), whether the field is from raw data or derived, a short description, and the metric units (where applicable).
Note that the units will remain constant as UK metric units. Daiser will be overriding a participants’ default units setting to unify the data as UK metric before data transfer. The Fitbit API documentation outlines the default UK metric units.
Please also refer to the Fitbit Web API Data Dictionary for more information.
Note that the AHAH Data Source refers to the Access to Healthy Assets & Hazards (AHAH) dataset1The data for this research have been provided by the Geographic Data Service (geods.ac.uk), a Smart Data Research UK Investment: ES/Z504464/1.. The reference data used is Version 4 (released 2024).
Download the data dictionary here
Table Name |
Data Source |
Database Field Name |
Resolution |
Field Type |
Units |
Description |
|---|---|---|---|---|---|---|
Fitbit Daily Sumary |
Fitbit |
sheffield_id |
permanent |
source |
Unique participant identifier |
|
Fitbit |
date |
daily |
source |
date |
Date of record |
|
Fitbit |
calories |
daily |
source |
kcal |
The number of daily calories burned |
|
Fitbit |
minutessedentary |
daily |
source |
mins |
Total minutes the user was sedentary, i.e. actiivities with a metabolic equivalent of task of less than 1.5 |
|
Fitbit |
minuteslightlyactive |
daily |
source |
mins |
Total minutes the user was lightly active, i.e. actiivities with a metabolic equivalent of task of 1.5 - 3.0 |
|
Fitbit |
minutesfairlyactive |
daily |
source |
mins |
Total minutes the user was fairly active, i.e. actiivities with a metabolic equivalent of task of 3.0 - 6.0 |
|
Fitbit |
minutesveryactive |
daily |
source |
mins |
Total minutes the user was very active, i.e. actiivities with a metabolic equivalent of task of more than 6.0 |
|
Fitbit |
steps |
daily |
source |
Total daily step count |
||
Fitbit |
heartratecardiominutes |
daily |
source |
mins |
Number of minutes spent in Cardio heart rate zone, defined as between 70% - 84% of the user’s maximum heart rate |
|
Fitbit |
heartratefatburnminutes |
daily |
source |
mins |
Number of minutes spent in Fat Burn heart rate zone, defined as between 50% - 69% of the user’s maximum heart rate |
|
Fitbit |
heartrateresting |
daily |
source |
beats per min |
Beats per minute value while at complete rest. Uses heart rate data from both awake and asleep states to estimate resting heart rate |
|
Fitbit |
heart_mean |
daily |
derived |
beats per min |
Average (mean) heart rate (unfiltered) |
|
Fitbit |
heart_min |
daily |
derived |
beats per min |
Minimum daily heart rate (unfiltered) |
|
Fitbit |
heart_max |
daily |
derived |
Maximum daily heart rate (unfiltered) |
||
Fitbit |
heart_n_samples |
daily |
derived |
beats per min |
Number of data points used to derive daily measure (unfiltered) |
|
Fitbit |
filtered_heart_mean |
daily |
derived |
beats per min |
Average (mean) heart rate after filtering data excluded from the configurable pipeline filter |
|
Fitbit |
filtered_heart_min |
daily |
derived |
beats per min |
Minimum daily heart rate after filtering data excluded from the configurable pipeline filter |
|
Fitbit |
filtered_heart_max |
daily |
derived |
beats per min |
Maximum daily heart rate after filtering data excluded from the configurable pipeline filter |
|
Fitbit |
filtered_heart_n_samples |
daily |
derived |
Number of data points used to derive daily measure after filtering data excluded from the configurable pipeline filter |
||
Fitbit |
caloriesBMR |
daily |
source |
kcal |
Total number of basal metabolic rate calories burned for the day. Does not include calories burned above sedentary level |
|
Fitbit |
distance |
daily |
source |
kilometers |
Total daily distance travelled |
|
Fitbit |
elevation |
daily |
source |
metres |
Total elevation travelled for the day |
|
Fitbit |
floors |
daily |
source |
The equivalent floors climbed for the day |
||
Fitbit |
breathingRate |
daily |
source |
breaths per minute |
Average number of breaths taken per minute |
|
Fitbit |
vo2Max |
daily |
source |
mL/kg/min |
Also known as cardio fitness score. Device measure of the maximum rate at which the user’s heart, lungs, and muscles can effectively use oxygen during exercise |
|
Fitbit |
dailyRmssd |
daily |
source |
ms |
The Root Mean Square of Successive Differences (RMSSD) between heart beats. It measures short-term variability in the user’s daily heart rate in miliseconds |
|
Fitbit |
deepRmssd |
daily |
source |
ms |
The Root Mean Square of Successive Differences (RMSSD) between heart beats. It measures short-term variability in the user’s heart rate whilst in deep sleep, in miliseconds |
|
Fitbit |
sleep_deep_minutes |
daily |
source |
mins |
Number of minutes spent in deep sleep |
|
Fitbit |
sleep_light_minutes |
daily |
source |
mins |
Number of minutes spent in light sleep |
|
Fitbit |
sleep_rem_minutes |
daily |
source |
mins |
Number of minutes spent in rem sleep |
|
Fitbit |
sleep_wake_minutes |
daily |
source |
mins |
Number of minutes spent in wake or awake stages |
|
Fitbit |
sleep_minutesToFallAsleep |
daily |
source |
mins |
The number of minutes it took the user to fall asleep |
|
Fitbit |
timeInBed |
daily |
source |
mins |
Number of minutes spent in bed. Calculation: timeInBed = minutesAfterWakeup + minutesAsleep + minutesAwake + minutesToFallAsleep |
|
Fitbit |
minutesToFallAsleep |
daily |
source |
mins |
Number of minutes it took the user to fall asleep. This value will almost always be 0 |
|
Fitbit |
minutesAwake |
daily |
source |
mins |
Number of minutes spend in wake or awake stages |
|
Fitbit |
minutesAsleep |
daily |
source |
mins |
Number of minutes spend in deep, rem, light, or asleep stages |
|
Fitbit |
SPO2_min |
daily |
source |
percentage |
The minimum daily oxygen saturation level calculated as a percentage value |
|
Fitbit |
SPO2_max |
daily |
source |
percentage |
The maximum daily oxygen saturation level calculated as a percentage value |
|
Fitbit |
SPO2_avg |
daily |
source |
percentage |
The mean of the 1 minute oxygen saturation levels calulcated as a percentage value |
|
Fitbit |
tempCore |
daily |
source |
celsius |
Core temperature data logged manually by a user |
|
Intraday Activities |
Fitbit |
sheffield_id |
permanent |
source |
Unique participant identifier |
|
Fitbit |
date |
daily |
source |
date |
Date of record |
|
Fitbit |
time |
5 minutes |
source |
time |
Time of record |
|
Fitbit |
timestamp |
5 minutes |
source |
datetime |
Date and time of record |
|
Fitbit |
heart_mean |
5 minutes |
derived |
beats per min |
Average (mean) heart rate in aggregated time window |
|
Fitbit |
heart_min |
5 minutes |
derived |
beats per min |
Minimum heart rate in aggregated time window |
|
Fitbit |
heart_max |
5 minutes |
derived |
beats per min |
Maximum heart rate in aggregated time window |
|
Fitbit |
heart_n_samples |
5 minutes |
derived |
beats per min |
Number of data points in aggregated time window |
|
Fitbit |
filtered_heart_mean |
5 minutes |
derived |
beats per min |
Average (mean) heart rate in aggregated time window |
|
Fitbit |
filtered_heart_min |
5 minutes |
derived |
beats per min |
Minimum heart rate in aggregated time window |
|
Fitbit |
filtered_heart_max |
5 minutes |
derived |
beats per min |
Maximum heart rate in aggregated time window |
|
Fitbit |
filtered_heart_n_samples |
5 minutes |
derived |
beats per min |
Number of data points in aggregated time window |
|
Fitbit |
steps_sum |
5 minutes |
derived |
Total number of steps in aggregated time window |
||
Fitbit |
steps_n_samples |
5 minutes |
derived |
Number of data points in aggregated time window |
||
Intraday LSOA |
GPS |
sheffield_id |
permanent |
source |
Unique participant identifier |
|
GPS |
date |
daily |
source |
date |
Date of record |
|
GPS |
time |
5 minutes |
source |
time |
Time of record |
|
GPS |
timestamp |
5 minutes |
source |
datetime |
Date and time of record |
|
GPS |
latest_lsoa21nm |
5 minutes |
derived |
Lower Super Output Area Name |
||
GPS |
latest_lsoa21cd |
5 minutes |
derived |
Lower Super Output Area Code |
||
Intraday Mobility |
GPS |
sheffield_id |
permanent |
source |
Unique participant identifier |
|
GPS |
date |
daily |
source |
date |
Date of record |
|
GPS |
time |
5 minutes |
source |
time |
Time of record |
|
GPS |
timestamp |
5 minutes |
source |
datetime |
Date and time of record |
|
GPS |
dist_travelled |
5 minutes |
derived |
metres |
Total distance travelled in aggregated time window, calculated from GPS movement |
|
GPS |
mean_speed |
5 minutes |
derived |
metres per sec |
Average (mean) speed of travel in aggregated time window, calculated from GPS movement |
|
GPS |
mobility_n_samples |
5 minutes |
derived |
Number of data points in aggregated time window |
||
GPS |
n_unique_lsoas |
5 minutes |
derived |
Number of unique Lower Super Output Areas in aggregated time window |
||
Intraday Environmental |
GPS |
sheffield_id |
permanent |
source |
Unique participant identifier |
|
GPS |
date |
daily |
source |
date |
Date of record |
|
GPS |
time |
hourly |
source |
time |
Time of record |
|
GPS |
timestamp |
hourly |
source |
datetime |
Date and time of record |
|
GPS |
env_n_samples |
hourly |
derived |
Number of data points in aggregated time window |
||
AHAH |
ah4blue |
hourly |
source |
mins |
Drive-time to nearest Bluespace (minutes) |
|
AHAH |
ah4dent |
hourly |
source |
mins |
Drive-time to nearest Dentist (minutes) |
|
AHAH |
ah4gp |
hourly |
source |
mins |
Drive-time to nearest GP Practice (minutes) |
|
AHAH |
ah4hosp |
hourly |
source |
mins |
Drive-time to nearest Hospital (minutes) |
|
AHAH |
ah4phar |
hourly |
source |
mins |
Drive-time to nearest Pharmacy (minutes) |
|
AHAH |
ah4gpas |
hourly |
source |
Normalised Difference Vegetation Index (NDVI) value indicating Passive Green Space. Low values of NDVI generally correspond to barren areas of rock, sand, exposed soils, or snow, while higher NDVI values indicate greener vegetation. Values range from -1 to 1. |
||
AHAH |
ah4no2 |
hourly |
source |
micrograms per cubic meter |
Annual mean Nitrogen Dioxide (ugm3) |
|
AHAH |
ah4so2 |
hourly |
source |
micrograms per cubic meter |
Annual mean Sulphur Dioxide (ugm3) |
|
AHAH |
ah4pm10 |
hourly |
source |
micrograms per cubic meter |
Annual mean Particulate Matter (ugm3) |
|
AHAH |
ah4ffood |
hourly |
source |
mins |
Drive-time to nearest Fast Food Outlet (minutes) |
|
AHAH |
ah4gamb |
hourly |
source |
mins |
Drive-time to nearest Gambling Outlet (minutes) |
|
AHAH |
ah4pubs |
hourly |
source |
mins |
Drive-time to nearest Pubs/Bars/Nightclubs (minutes) |
|
AHAH |
ah4tob |
hourly |
source |
mins |
Drive-time to nearest Tobacconists/Vape Store (minutes) |
|
AHAH |
ah4leis |
hourly |
source |
mins |
Drive-time to nearest Leisure Centre (minutes) |
|
AHAH |
ah4h |
hourly |
source |
Health Domain Score |
||
AHAH |
ah4g |
hourly |
source |
Green/Bluespace Domain Score |
||
AHAH |
ah4e |
hourly |
source |
Air Quality Domain Score |
||
AHAH |
ah4r |
hourly |
source |
Retail Domain Score |
||
AHAH |
ah4ahah |
hourly |
source |
Access to Healthy Assets and Hazards Index Score |
||
AHAH |
ah4ahah_rnk |
hourly |
source |
AHAH Index Ranked |
||
AHAH |
ah4ahah_pct |
hourly |
source |
AHAH Index percentiles |
Proposed tables (post-MVP)#
After the initial MVP phase, development will continue to incorporate data streams from Baseline Questionnaires and Health App data, alongside linking the clean data to NHS records.
Database architecture#
The Smart Health database has a data lake architecture, using Apache Parquet file formats stored in Amazon Web Services (AWS) Simple Storage Solution (S3) object storage. This object storage is often referred to as a “bucket”. S3 storage is cost-effective and highly scalable. It can also be scaled independently from the compute resources as needed.
The Smart Health database is entirely handled within a highly access-restricted RONIN cloud-computing environment.
This design is a highly-secured, cost-effective, and performance-optimised analytical data store. It prioritises security and compliance through the RONIN Secure Data Environment (SDE) while using an industry-standard data lake architecture to enable fast, scalable analysis.
Data Format#
Data is stored as Apache Parquet files within the S3 buckets.
Apache Parquet is an open source, column-oriented data file format designed for efficient data storage and retrieval. It provides high performance compression and encoding schemes to handle complex data in bulk and is supported in many programming languages and analytics tools.
In summary, this format is fast to query, cost-effective, and avoids vendor lock-in.
Parquet files also contain schema metadata, enabling query engines to understand the data structure on the fly in a schema-on-read data processing approach.
Directory Structure#
The Parquet files are structured within file directories analagous to a typical file explorer system.
As the expected data volume is large, each table will be divided into smaller chunks in a process called partitioning. Each dataset will be partitioned by date. This is discussed in detail below.
Overall, the directory structure containg the files is as follows:
Note
This structure outline corresponds to the MVP data only
├── clean_bucket
│   └── year
│       └── month
│           └── day
│               ├── clean_environmental_YYYY-MM-DD.parquet
│               ├── clean_fitbit_intraday_YYYY-MM-DD.parquet
│               ├── clean_fitbit_summary_YYYY-MM-DD.parquet
│               ├── clean_lsoa_YYYY-MM-DD.parquet
│               └── clean_mobility_YYYY-MM-DD.parquet
Data Partitioning#
Data partitioning is an optimisation techique used in data lakes. Large datasets are physically divided into smaller, more managable sub-datasets using one or more specified columns. Typically, the columns used are frequently queried. For example, in the Smart Health database, we partition by date as the dataset is updated on a daily basis.
By partitioning the data, a query engine can read only the files needed for a particular query. This reduces the amount of data scanned and lowers query cost whilst improving performance.
Querying the database#
The Data Connect team will use DuckDB2DuckDB is a simple, light-weight, and open-source database system. to query the Smart Health data lake.
There are a number of benefits of using this tool, including:
DuckDB runs in-process, meaning no dedicated server infrastructure is needed to host the database; instead, the user’s virtual machine resources are used.
DuckDB can read parquet files directly from the S3 bucket and leverage the data partitioning to only query the necessary data.
As a columnar database, it is suited to analytical queries and makes use of the benefits of Parquet file formats
DuckDB offers a host of advance SQL features referred to as “friendly SQL”, making queries easier and faster to write and execute.
Multiple data scientists will be able to concurrently read from the Smart Health database to create research data extracts.
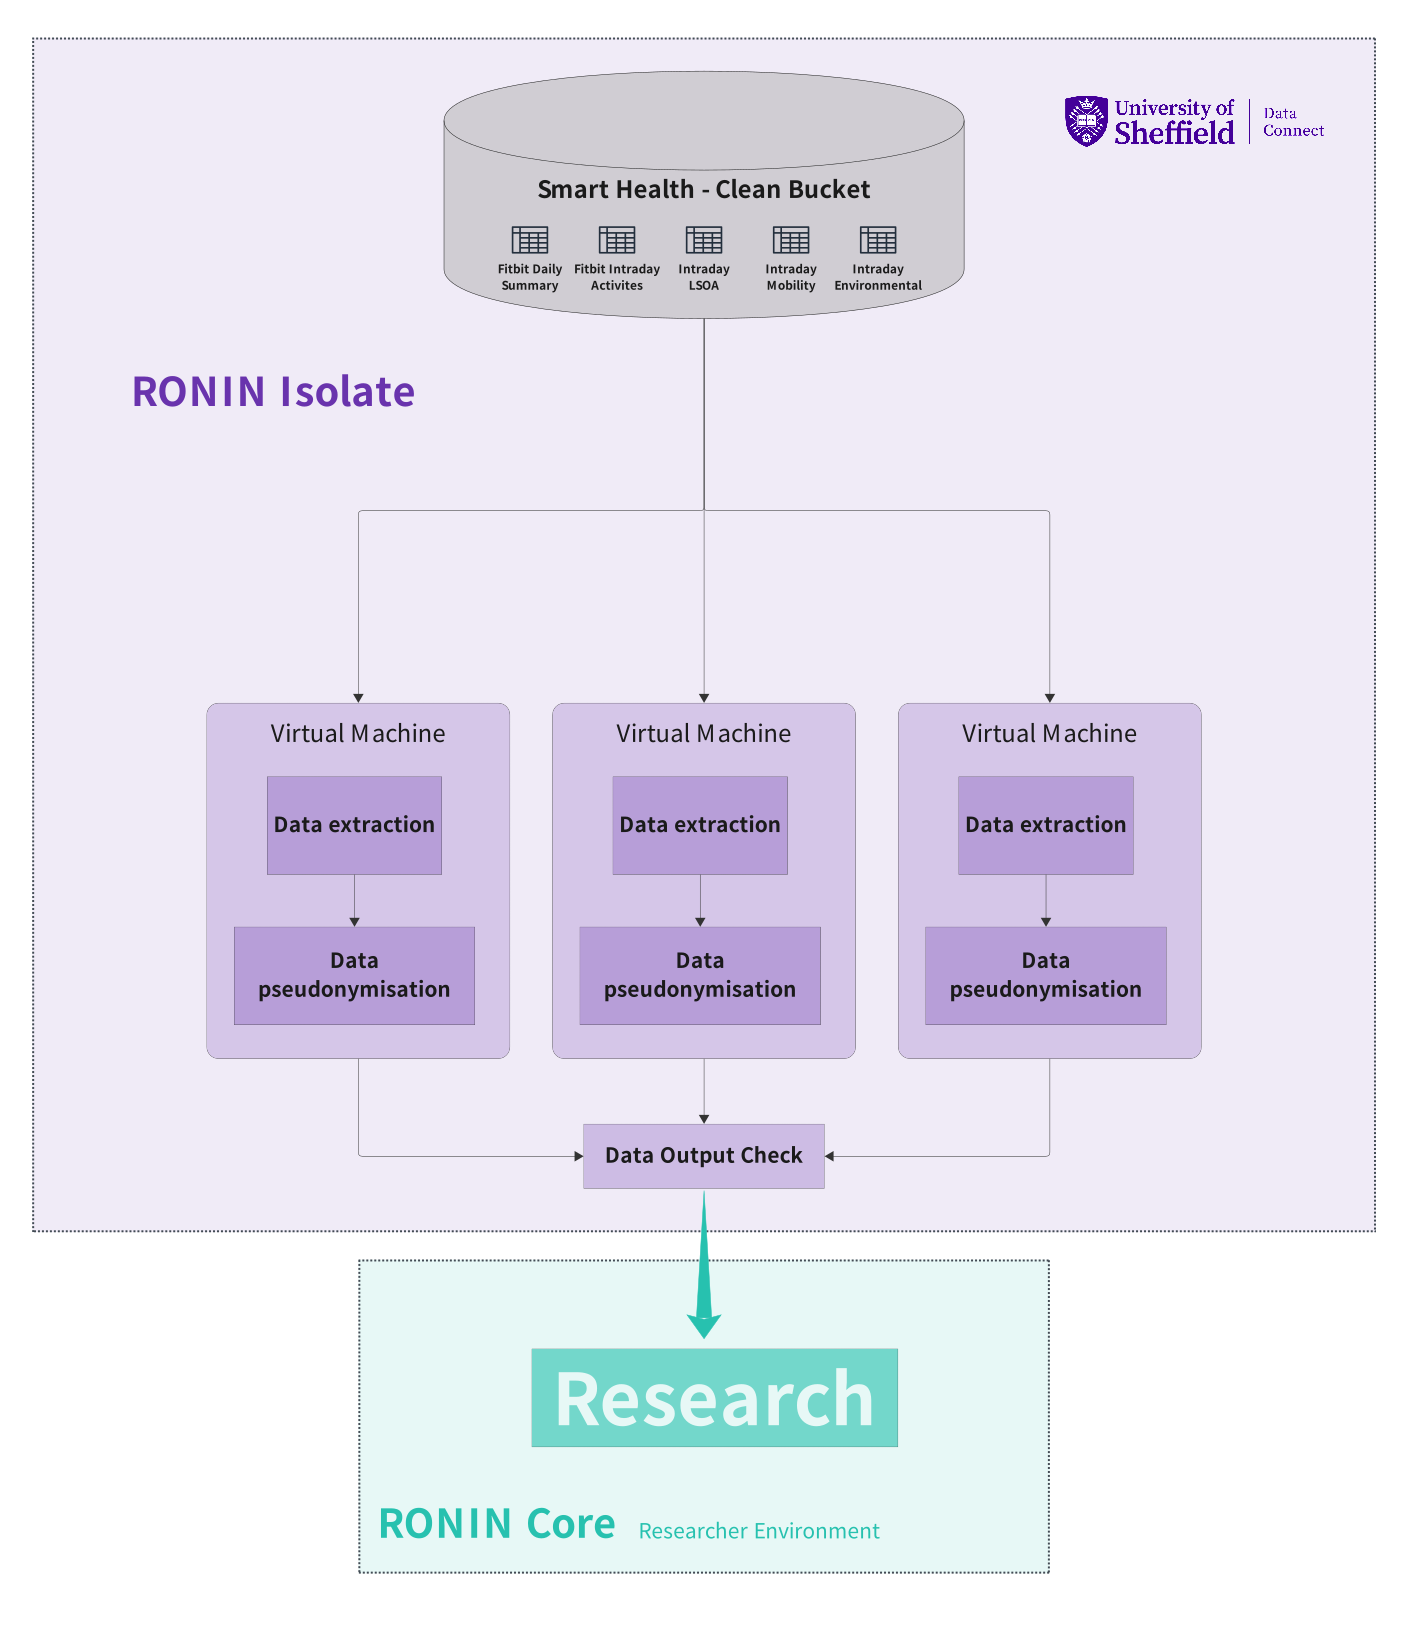
The Smart Health database can be simultaneously queried by multiple virtual machines within the RONIN Isolate environment. After egress checking, fully pseudonymised data extracts from the Smart Health database can be transferred to researchers’ Secure Data Environments in RONIN Core#